 gitsilence 的个人博客
Coding...
目录
日志采集和监控可视化监控
日志采集和监控可视化监控

日志采集并监控
需求分析
日志格式为:
2022-03-21 17:55:44.747 |-INFO [http-nio-8086-exec-193] com.xx.xx.controller.SearchController [31] -| [execute(65)][430]>执行【事件检索】耗时:374ms.
需要解析出前面的时间戳、(执行动作)、耗时时间
实时入库,并可视化分析
自定义普罗米修斯的exporter实时监控
1、构建好 go 语言环境
2、创建项目模块
go mod init phsearch/exporter
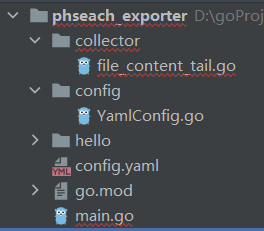
3、创建文件夹 config、collector
-
file_content_tail.go
package log_watch import ( "fmt" "github.com/hpcloud/tail" "github.com/prometheus/client_golang/prometheus" "os" "regexp" "strconv" "time" ) func WatchLog(filename string, latency prometheus.Gauge, total *prometheus.CounterVec) { _, err := os.Stat(filename) if os.IsNotExist(err) { fmt.Println("文件不存在 ...") } fmt.Println(" ======================== ") config := tail.Config{ // true 则文件被删掉阻塞等待创建该文件,false 则文件被删掉时程序结束 ReOpen: true, // true 则一直阻塞并监听指定文件,false 则一次读完就结束程序 Follow: true, // 使用 Linux 的 Poll 函数,poll 的作用是把当前文件指针挂到等待队列 Poll: true, // 为true 则没有找到文件就报错并结束,false则没有找到文件就阻塞保持住 MustExist: false, /** 指定开始读取的位置 offset 从第几个下标列开始读,Offset:2 即为 第一行的第三列 whence: - 0: 距离文件开头 - 1: 当前的位置 - 2: 距离文件末尾 */ Location: &tail.SeekInfo{Offset: 0, Whence: 2}, } t, _ := tail.TailFile(filename, config) for line := range t.Lines { fmt.Println("original content:", line.Text) _, action, duration := matchData(line.Text) fmt.Println("orginnal duration: ", duration) if duration == "" { continue } durationFloat, _ := strconv.ParseFloat(duration, 64) latency.Set(durationFloat) fmt.Println("sleep ....") time.Sleep(time.Duration(10) * time.Second) latency.Set(0.0) total.With(prometheus.Labels{"request": action}).Inc() } } func matchData(lineText string) (string, string, string) { timeRegex, _ := regexp.Compile("(\\d{4}-\\d{2}-\\d{2} \\d{2}:\\d{2}:\\d{2}\\.\\d{3})") actionRegex, _ := regexp.Compile("执行【(.*)】") durationRegex, _ := regexp.Compile("耗时:(\\d+)ms") searchTime := timeRegex.FindStringSubmatch(lineText) action := actionRegex.FindStringSubmatch(lineText) duration := durationRegex.FindStringSubmatch(lineText) if len(searchTime) == 0 || len(action) == 0 || len(duration) == 0 { return "", "", "" } fmt.Println("当前时间:" + searchTime[0], "动作:" + action[1], "耗时:" + duration[1] + " ms") return searchTime[0], action[1], duration[1] } -
YamlConfig.go
package config import ( "fmt" "gopkg.in/yaml.v2" "io/ioutil" "os" ) type Log struct { Path string `yaml:"path"` } func (log *Log) SetPath(path string) { log.Path = path } type Config struct { Log Log `yaml:"log"` } func (conf *Config) SetLog (log Log) { conf.Log = log } func isExists(filename string) bool { _, err := os.Stat(filename) return err == nil } func getConf() Config { var conf Config //conf := Config{} var filename = "./config.yaml" if isExists(filename) { yamlFile, err := ioutil.ReadFile(filename) if err != nil { fmt.Println(err.Error()) } yaml.Unmarshal(yamlFile, &conf) return conf } _, err := os.Create(filename) if err != nil { fmt.Println(err.Error()) } return conf } func Init() Config{ return getConf() } -
main.go
package main

import (
	"fmt"
	"github.com/prometheus/client_golang/prometheus"
	"github.com/prometheus/client_golang/prometheus/promhttp"
	"log"
	"net/http"
	logOperate "phsearch/exporter/collector"
	configProperty "phsearch/exporter/config"
)

func main() {
	config := initConfig()
	path := config.Log.Path
	if path == "" {
		fmt.Println("log.path 不能为空 ...")
		return
	}
	requestLatency := prometheus.NewGauge(prometheus.GaugeOpts{
		Name: "request_latency",
		Help: "Current elasticsearch latency of search",
	})

	requestTotal := prometheus.NewCounterVec(
		prometheus.CounterOpts{
			Name: "request_record_total",
			Help: "number of request",
		},
		[]string{"request"},
	)

	prometheus.MustRegister(requestLatency)
	prometheus.MustRegister(requestTotal)

	// 创建一个线程
	go logOperate.WatchLog(path,
		requestLatency, requestTotal)

	http.Handle("/metrics", promhttp.Handler())
	log.Print("log is running, http port : 31256 ....")
	log.Fatal(http.ListenAndServe(":31256", nil))
	//logOperate.WatchLog("./log-watch/file.log")

}

func initConfig() configProperty.Config {
	var config configProperty.Config
	config = configProperty.Init()
	return config
}
-
Prometheus 配置 targets
scrape_configs:
  - job_name: "phsearch_elasticsearch_seach"
    scrape_interval: 3s # Set the scrape interval to every 15 seconds. Default is every 1 minute.
    static_configs:
      - targets: ["192.168.2.44:31256"]
通过 logstash 实时监控
1、构建好 ELK 环境
2、编写 logstash 配置
input {
  file {
    path => "/home/admin/logs/phsearch/common-default.log"
    start_position => "beginning"
  }
}

filter {

  if "耗时" not in [message] {
    drop{}
  } else {
    grok {
      match => { "message" => "耗时:%{NUMBER:duration}" }
    }
    mutate {
      remove_field => ["@version"]
    }
  }
}

output {
  elasticsearch {
    hosts => "192.168.167.240:9200"
    index => "test_log"
  }
  stdout {
    codec => rubydebug
  }
}
mutate: 可以用来加字段,删除字段
grok : 通过正则进行匹配内容、定义字段
start_position: 开始位置,默认是 end
数据实时导入到 elasticsearch
然后使用 kibana 进行数据可视化